
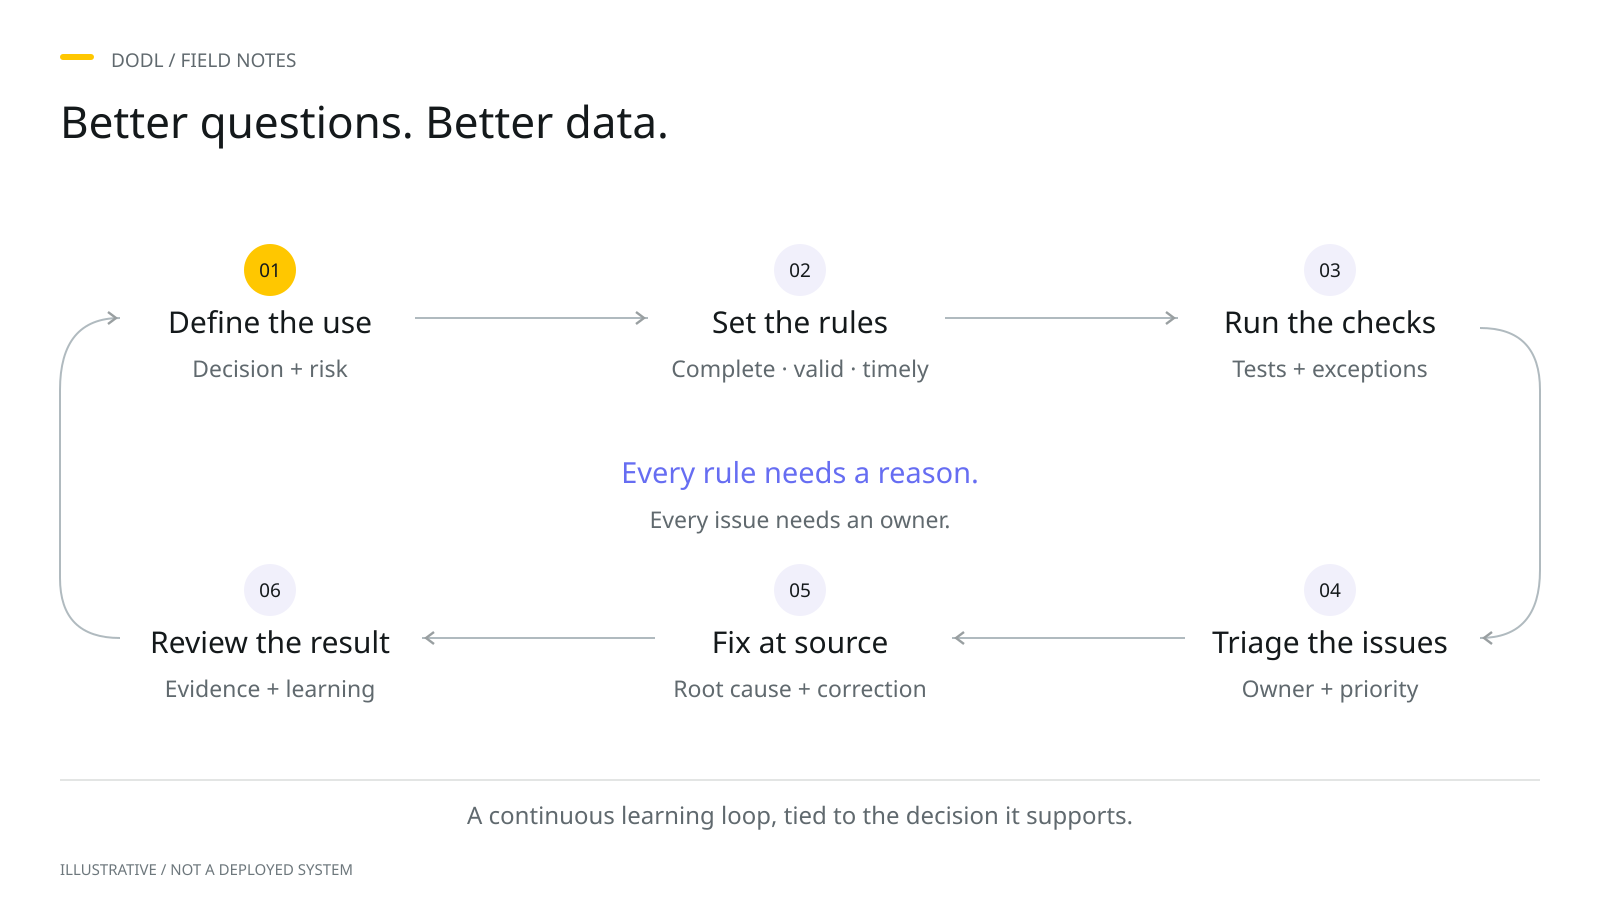
An editorial preview prepared for this diary, awaiting the author’s review. Examples are hypothetical.
Quality for what purpose?
Asking whether data is good can start a discussion, but it rarely finishes one. A dataset may be timely enough for a monthly planning exercise and too slow for a decision made during the working day. A missing field may be essential for one service and irrelevant to another. Before deciding what to measure, ask what the data needs to help somebody do. This gives quality a purpose, identifies the people affected, and creates a way to discuss tradeoffs without reducing a complex situation to a single reassuring score.
Imagine a hypothetical team planning appointments for the coming week. The database contains a contact number for almost every person, so the completeness measure looks strong. Yet some numbers are out of date, and staff cannot reach people to confirm their appointments. Completeness is still worth understanding, but it does not answer the operational question. The team needs to know whether it can make contact in time. Starting with that need changes the conversation from filling empty cells to understanding how the information supports a useful outcome.
Describe the consequence
Ask a user to describe the last time the data made work difficult. What were they trying to do? Which uncertainty changed their decision? What did they have to check manually? A concrete example can reveal a problem that a general request for better data leaves hidden. It also helps avoid assumptions about impact. An inconsistent label might be inconvenient but easy to interpret. A plausible-looking date in the wrong field might pass a basic check and still send a process in the wrong direction.
For each concern, write a short consequence statement. In the appointment example, an outdated number may prevent a timely confirmation and create additional follow-up work. Keep the statement proportionate to the evidence. If the team has not measured the downstream effect, describe the observed difficulty rather than attaching an invented cost or outcome. The statement should explain why somebody cares, while leaving space to investigate the scale of the issue. This makes prioritisation more transparent and helps technical colleagues understand what a useful improvement would look like.
Quality has a purpose.
- Purpose
What will this data help us do?
- Risk
What happens if it is wrong?
- The right check
What quality does this use need?
Turn the need into a check
A useful quality rule connects a field or a process to the intended use. Define the population it covers, the condition it tests, and the moment when the result matters. State the exceptions that are expected and the limitations of the check. For example, a contact field can have an acceptable format without representing the right person or a working number. Format validation is a useful control, but its label should describe exactly what it establishes. Clear names protect users from interpreting a narrow check as a broad guarantee.
Separate detection from correction. A check may identify records needing review without telling the team what the right value should be. Decide who can investigate, what evidence they need, and how any correction should reach the original source. Where possible, resolve a recurring problem in the process that creates it. Repeatedly repairing a reporting extract can keep a deadline moving while leaving the same issue ready to return. A temporary fix may be justified, but it should remain visible alongside the longer-term action and the person responsible for it.
Choose a threshold with people
Thresholds should reflect an agreed use and response. A target is less helpful when nobody can explain what happens if it is missed. Bring the people who use and maintain the data into the discussion. Ask what level of uncertainty they can work with, what additional review would be practical, and which situations require a different route. Avoid copying a convenient percentage from another dataset. Similar-looking fields can support very different decisions, and the consequences of an issue may depend on the particular records affected.
Show the count as well as the rate. A percentage can conceal the size of the population, while a total can conceal how widely a problem is spread. Add the reporting period and explain whether the same record may appear more than once. Where a segment matters to the intended use, examine it directly rather than relying only on an average. The purpose is not to produce a more elaborate dashboard. It is to make the result interpretable enough that someone can decide what to do next.
Build the response into the measure
Every important measure needs a route to action. Define who reviews it, how often, and where issues are recorded. Distinguish an unexpected change from a known exception, and give users a way to explain what the metric cannot show. A recurring review can be short: what changed, what matters, and what happens next. When a check repeatedly produces a result that nobody acts on, revisit its purpose. The rule may be poorly targeted, the responsibility unclear, or the work needed to respond greater than the team can support.
Record uncertainty honestly. Some checks depend on an incomplete reference source or a judgement that requires a person. Some problems can be found only after an attempted use. These limitations do not make a measure worthless; they explain how to use it responsibly. In the hypothetical appointment process, the team might distinguish a valid-looking number from a recently confirmed one. That simple distinction gives users more information than treating both as equally reliable. It can also guide an appropriate confirmation step without implying certainty that the data does not contain.
Return to the original question
After an improvement, return to the work that prompted it. Can staff now complete the intended task with less uncertainty? Has the manual checking changed? Are corrections lasting, or is the same issue reappearing through another route? A stronger score is useful evidence, but it should be considered with these observations. Sometimes a rule improves while the user experience remains difficult because the rule covers only one part of the process. This is a reason to refine the question and the control, rather than declare the work finished.
A practical first step is to take one existing quality metric and write four lines beside it: the decision it supports, the consequence of failure, the action triggered by the result, and the person responsible for that action. If one line is difficult to complete, start a conversation with the relevant team. You may discover that the metric needs a clearer definition, or that a different question matters more. Useful quality management grows from that connection between information and work, one well-understood check and one manageable response at a time.
Ask what the data must help someone do, then connect every important check to a consequence, a response, and an owner.
Put the thought into practice.
A practical starting template. Download it and adapt it to your own context.
Download resource (CSV)What could this look like in your organization?
Add your context and build a brief for your AI assistant, or download a video storyboard for this entry.
Open the application guide